Tutorial on CATH and Gene3D
Introduction
In this practical, you will be introduced to the CATH/Gene3D websites and web servers that will help you carry out an investigation into protein structure and function.
IMPORTANT NOTES
This tutorial refers to a number of external websites. It is highly recommended that you click the link with the right-hand mouse button and select either open link in new window or open link in new tab so that you don't navigate away from this page.
There are JSmol applets embedded in this tutorial which will allow you to explore a number of different structures. Initially, they will display a simple wireframe model. Please click the grey button next to the applet with your left mouse button to display the structure as required for the tutorial. If for any reason an applet does not display correctly, please refresh your browser.
A Short Introduction to CATH and Gene3D
CATH is a manually-curated hierarchical classification of protein domain structures. The name CATH derives from the initials of the top four levels of the classification - (C)lass, (A)rchitecture, (T)opology and (H)omologous Superfamily.
- Class refers to the secondary structure content (e.g. mainly-alpha, mainly-beta, mixed alpha/beta or 'few secondary structures').
- Architecture refers to the general arrangement of the secondary structures irrespective of connectivity between them (e.g. alpha/beta sandwich).
- Topology, also known as the 'fold' level, takes into account the connectivity of secondary structures in the chain.
- Homologous Superfamily refers to domains that are believed to be related by a common ancestor.
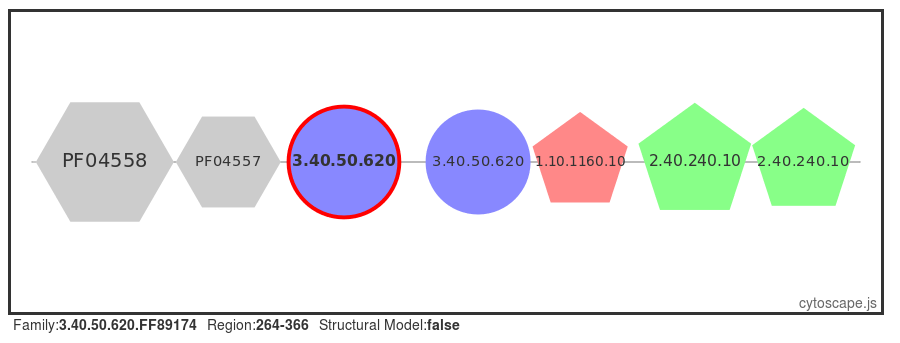
Each level has a CATH code associated with it. Have a look at the following:
In this example, the CATH code is 3.40.50.620. The 3 refers to the class to which the domain belongs (mixed alpha-beta), the 3.40 refers to the architecture, the 3.40.50 refers to the actual fold (topology) the domain adopts and 3.40.50.620 is the homologous superfamily code.
Domain codes (e.g 1n3lA01) are broken up as follows: the first 4 letters/numbers make up the domain's PDB (Protein Data Bank) code, the letter after that refers to the polypeptide chain ID of the domain you are looking at and the last two numbers refer to the domain number. In the case of a protein chain having a single domain comprising the whole chain length, the domain number will be 00. Otherwise, the domains will be labelled, 01, 02 and so on.
Gene3D extends the CATH superfamilies to sequenced genomes and the major protein sequence repositories (i.e. UniProt and Ensembl) through the generation of a set of statistical models (hidden Markov models or HMMs). For each superfamily, use of the sophisticated HMM search software HMMER3, and an in-house algorithm called DomainFinder resolve potential matches into a unified multi-domain architecture (MDA). These predicted sequence domains are presented in Gene3D. Gene3D also merges in many different sources of protein function annotation, ranging from pathway data to interaction data, and presents these through a web interface with complex querying abilities.
Identifying the CATH Superfamily for a Query Structure
What is the number one question people always have about their protein?
What it does! What is the function of the protein you are investigating? Sometimes, we do not know the answer to that, at least not initially. Genomic and metagenomic sequencing projects have provided us with several million protein sequences, around 40% of which will be of unknown function. This number will only increase over time, so we need to develop ways to determine the structures of these proteins and their functions, either by experimentation or by using computational techniques.
You are going to look at how the CATH database can help us in identifying the function of a particular protein structure.
The PDB structure, 4i6g, is an X-ray crystallography-solved structure for which the function has yet to be determined. However, this can be inferred by comparing the protein with other proteins of known function. You can, for example, use the CATHEDRAL server to find a structural match in CATH. The CATHEDRAL server uses a structural comparison algorithm to compare a protein of interest (otherwise known as the 'query structure') against domains already classified in the CATH database. This means you can try to identify an unknown protein by comparing it with all known structures in CATH.
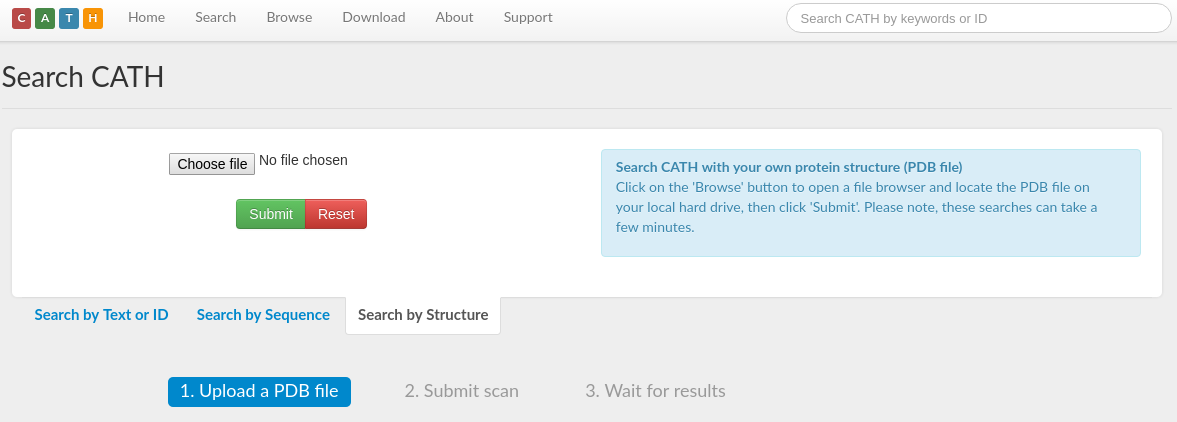
The CATHEDRAL server can be found here. Please click the link. This will take you to a page that looks like this:
Please download the PDB file for 4i6g from here. Upload the PDB file in the CATHEDRAL server and select 'Submit'. The server loads the name and the constituent chains of the uploaded PDB and displays it in a page that looks like this:
Each chain of the PDB can be submitted for structural scans separately. Submit chain A of the uploaded PDB to the structural scan by clicking on 'Submit Structure' for chain A. If the servers are busy, you might find that the job takes a long time to complete - you can skip the wait and view the previously calculated results here.
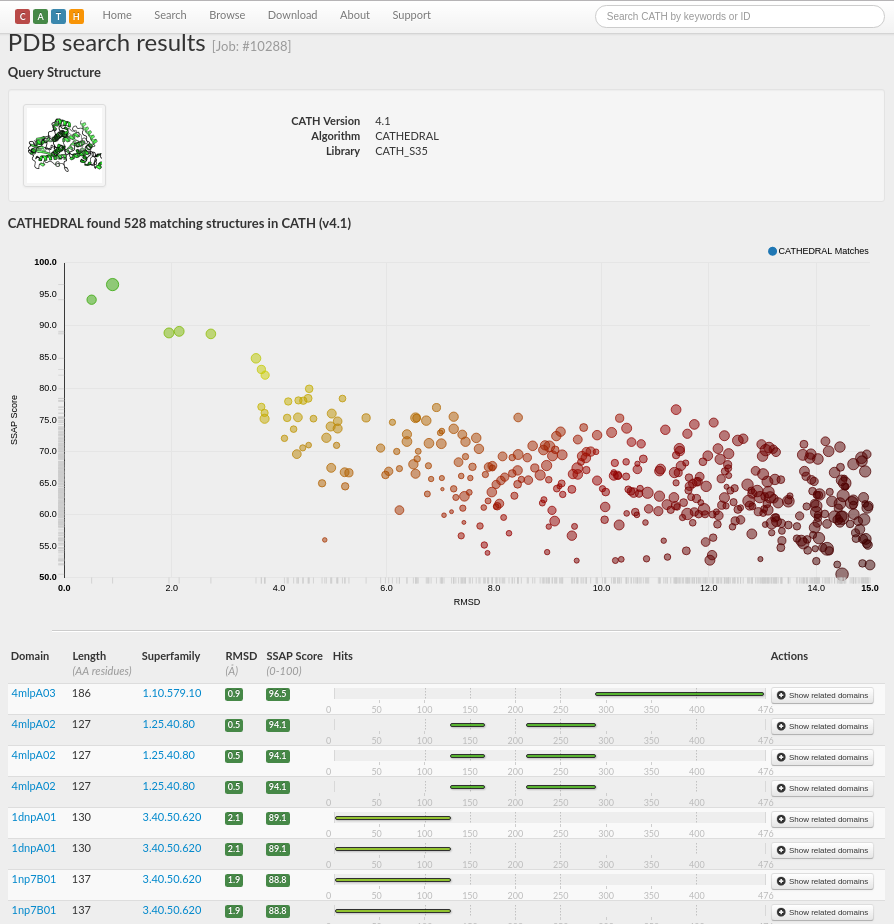
A total of 528 matching structures in CATH v4.1 have been found, with scores ranging from very good (in green) through to very poor (in red).
The results are sorted by a score calculated by the weighted average of, for example, normalised RMSD, percentage overlap, sequence identity and SSAP score, with those comparisons with the highest scores at the top of the page. RMSD is a frequently used measure of the average distance between the atoms (usually the backbone atoms) of superimposed proteins. The formula can be seen here.
For proteins containing ⇐ 150 residues, a good structural match can be inferred if the RMSD is 3.5 Ångstrom (Å) or less. For larger domains, homologous proteins may have slightly larger RMSD values.
The CATHEDRAL structural scan is run against a library of S35 representatives. For each CATH superfamily, all members are clustered into groups with 35% sequence identity, i.e. a S35 group. A representative of each S35 cluster is selected by finding the domain with the most average length and the best RMSD (within that cluster).
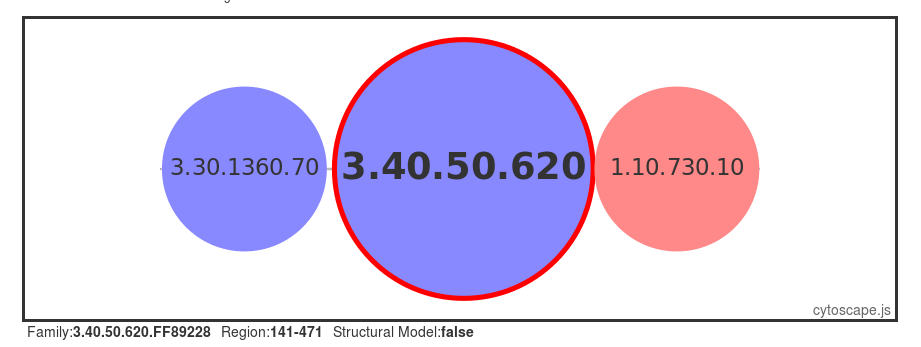
The results suggest that chain A of PDB 4i6g consists of multiple domains as there are three distinct regions of the chain with good structural matches. Matches with very good scores (i.e. in green) are listed to domains in the superfamilies 1.10.579.10, 1.25.40.80 and 3.40.50.620 (see screenshot below).
Each domain classified in CATH has its own entry on the CATH website. To discover more about each domain in the CATHEDRAL results list (e.g. in terms of structure, sequence and function), clicking on a domain id in the list will take you to the webpage for that particular domain.
Looking at the domain pages for the first four domain matches (from the PDB 4mlp) in the CATHEDRAL results list, we can see that they do not have any functional information assigned. However, if we click on the domain 1dnpA01 (for example, here) from the HUPs superfamily (CATH code: 3.40.50.620), we find that it is assigned the Enzyme Commission (EC) number 4.1.99.3 for Deoxyribodipyrimidine photo-lyase (click here for more info on EC numbers). As this is a very good structural match, it is highly likely that our query 4i6g performs the same, or very similar, function.
If you wish to explore other structural domains within a given S35 cluster, clicking on 'Show related domains' will open up a window containing the domain list. Clicking on a given domain ID will take you to its domain page. The data in the list can also be downloaded using the 'Download' button at the bottom of the window.
Please also visit the link to PDBsum on the domain page. PDBsum is a resource that stores information about all the protein files deposited in the PDB to learn more about the structural and functional characteristics of these domains.
The HUP Superfamily
We are now going to look more closely at the CATH superfamily in which 1dnpA01 is classified. This is the HUP domain superfamily (CATH code 3.40.50.620), named after High-signature proteins, UspA, and PP-loop NTPases which all contain this domain (reference). This superfamily is known to be structurally and functionally diverse (reference). Here, we give a brief tour of some of the information held about this superfamily as displayed by our newly re-designed webpages before demonstrating how the CATH website can help investigate this diversity.
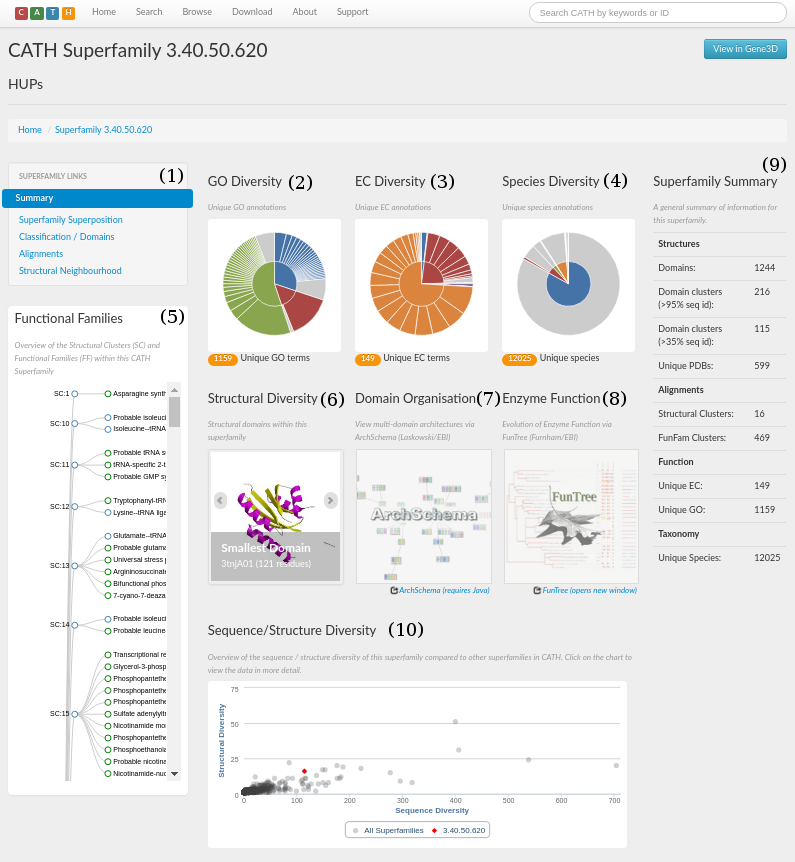
The CATH webpage for the HUP superfamily can be accessed here. A screenshot is shown in the figure below. There are a number of sections, which have been numbered 1 to 10.
Section 1 is a menu that you click on to navigate the site. From here you can explore the structural and functional features of the superfamily, references associated with all the protein domains within that superfamily, access to functionally annotated structural alignments, MDA, and the taxonomy browser.
A concise summary for the superfamily in the form of some useful statistics can be seen in section 9. It gives information on, for example, the number of domains, structural clusters and functional terms. For the HUP superfamily, it can be seen that there are 970 domains and that there are 112 unique EC numbers and 409 unique Gene Ontology (GO) terms associated with the superfamily (click here for more info on GO terms).
An indication of just how structurally diverse the HUP family is shown in section 6. Here, you can scroll through the smallest, largest and a representative structure (according to the number of residues) belonging to the HUP superfamily.
The box below shows a 3D structural superposition between the smallest (2pfsA01) and largest domain (1wkbA01) displayed using the program Jmol. What you see initially is a wireframe representation of the superposition, which isn't very clear for this purpose, but if you press the grey button labeled 'Click here', the two domains will be coloured differently and the wireframe representation will be replaced by a cartoon representation of the structures, making it much easier to compare them. 2pfsA01 is coloured blue. For 1wkbA01, those parts of the structure that superimpose well with 2pfsA01 are coloured red and the rest of the structure, termed structural embellishments, are coloured pink. This superposition shows considerable embellishments in the larger structure compared to 2pfsA01, indicating the structural diversity between these two relatives.
Species diversity information for this superfamily is displayed in the pie chat shown in section 4. Users can get information about the species present in the HUP superfamily via a mouseover (see picture below)
The Sequence/Structure diversity chart (Section 10) can be used to compare the sequence and structural diversity of the HUP superfamily with all of the other superfamilies in CATH. The HUP superfamily is highlighted in red and the number of sequence families and structural clusters it possesses compared to other families in CATH can be determined by mousing over the graphics representing each family. This shows that the HUP superfamily is more diverse in terms of both sequence and structure than most other families in CATH (see picture below)
Investigating the Structural and Functional diversity within the HUP Superfamily using CATH
This brings us to the next part of this tutorial in which we are going to explore the structural and functional diversity of the HUP superfamily using CATH. The structure and function of a protein are closely linked, so it is natural to assume that structural diversity is likely to result in functional diversity within a superfamily. Sections 2 and 3 on the homepage (see below) gives information on the functional diversity and lets you view the distribution of GO annotations and EC numbers associated with this superfamily. Placing your mouse over one of the pie segments gives the EC number or GO term, the name of that function and also the incidence of the functional annotation in question within the superfamily as a percentage. There are currently a total of 1159 GO annotations and 149 EC annotations for the HUP superfamily.
The HUP superfamily is known to be particularly functionally diverse. Here, we concentrate our efforts on looking at two domains 1od6A00 (EC 2.7.7.3) and 1f7uA01 (EC 6.1.1.19).
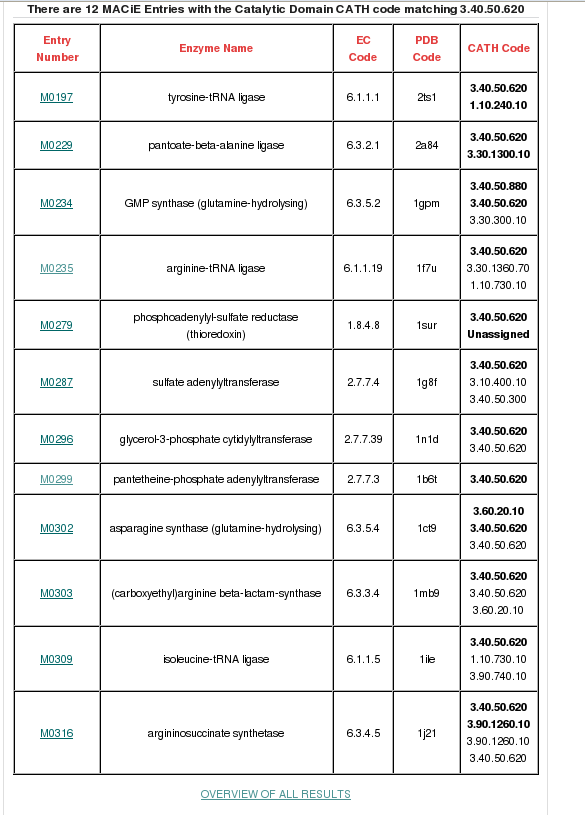
MACiE is a database maintained through a collaboration between the Thornton group at the European Bioinformatics Institute and the Mitchell Group at the University of St Andrew, and it stores enzyme reaction mechanisms. It can be searched by the Catalytic Domain CATH Code (in this case, 3.40.50.620). If you type in the CATH code in the field adjacent to the 'Search Catalytic Domain CATH code' button and then click, a page will be displayed providing all the general information held for the HUP superfamily. 12 different reaction mechanisms are recorded in MACiE for this superfamily. There are many relatives having different enzyme classification numbers at the third level (EC3) in this family, which is suggestive of changes in chemistry between some relatives within this superfamily (see figure below).
Note [2016/09/21]: the instructions in the following paragraph refer to a link in the MACiE website which currently does not work (2016/09/21). The MACiE authors have been notified and are working on the problem. If the link mentioned below continues to provide an error, the following paragraph can be safely skipped.
There is a link at the bottom of the page to an overview of all MACiE results for this superfamily labelled OVERVIEW OF ALL RESULTS which you can go through to explore the extent of the different enzyme reaction mechanisms present. It brings up a page where you can find more information on EC number distribution, CATH domain partners and information of the catalytic residues and cofactors present. Relatives in this superfamily have many different enzyme classifications at the third level (i.e. different EC3 numbers), which is suggestive of changes in chemistry throughout this superfamily (click here for more info on EC numbers).
If you then go back to the list of MACiE entries and click on the entries for our example domains (M0299, Pantothenate synthetase, EC 6.3.2.1 for 1od6A00 and M0235, Arginyl-tRNA synthetase, EC 6.1.1.19 for 1f7uA01), you can see the overall reactions for these enzymes. It can be seen that both 1od6A00 and 1f7uA01 are ligases, but they have different substrates and form different products.
It is clear from these results that the HUP superfamily is associated with a significant number of different enzyme reaction mechanisms. There are a number of possible reasons for this functional diversity. To explore how these enzymes may have evolved different functions, we can look for structural changes within the family. Here, we compare the structures of our two HUP domain examples using our in-house structural comparison algorithm called SSAP.
Whilst the CATHEDRAL algorithm you used at the beginning of the tutorial is fast and allows you to search all structures in CATH, SSAP is a slower and slightly more accurate method for comparing two protein structures.
SSAP takes two structures and calculates how similar they are in structure, residue-by-residue. Similarity is measured by the SSAP score. This score ranges from 0 to 100; a score of 100 would indicate that the two structures were effectively identical. Please click here to go to the SSAP server page. Type in 1od6A00 as Domain ID 1 and 1f7uA01 as Domain ID 2. Press 'GO'.
From this superposition we can see that the two domains are significantly different in structure. This structural divergence is also clearly highlighted by their SSAP score of 58.77 and an RMSD of 8.15Å.
The JSmol figure below shows the 3D SSAP superposition of the 2 structures 1od6A00 (light blue) and 1f7uA01 (pink). The catalytic residues for 1od6A00 and 1f7uA01 are coloured blue and red respectively.
The superposition shows that, although there is a structural core common to both structures, 1f7uA01 has some considerable structural embellishments not seen in 1od6A00. There are also noticeable shifts in the positions of the catalytic site residues.
2DSEC (reference) is an algorithm that provides a schematic representation of protein structural features. It employs a multiple structural alignment to create a summary of all the secondary structures present for each structure in the alignment. Circles represent alpha-helices and triangles a beta strand. The size of the circle or triangle is determined by the size of the secondary structure it is representing. Core secondary structure elements are represented as light pink circles and yellow triangles. Embellishments are coloured as dark pink circles and brown triangles.
The 2DSEC plot for the HUP examples 1f7uA01 and 1od6A00 is shown below:
The 2DSEC plot confirms the findings of the SSAP superposition; 1f7uA01 has some extensive structural embellishments, mainly alpha-helical regions, when compared to the smaller 1od6A00 structure.
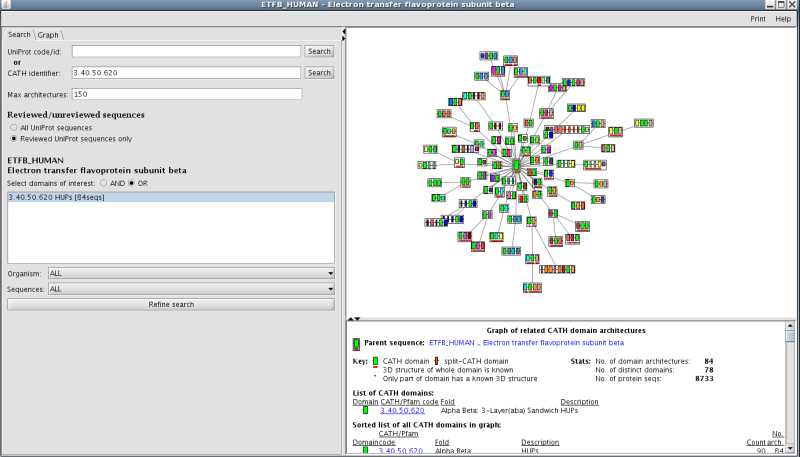
Recruitment of different domain partners can also result in changes in protein function. There is a link to a third party application called Archschema (reference) on the main superfamily home page (see section 7 on the homepage figure). This generates dynamic plots of related Pfam multi-domain architectures (MDAs). To get an overall view of the number of different, related Pfam architectures in this family, click on the link to boot up the application. You will get a graph of related CATH MDAs for this family. In order to view those architectures that are most likely to be accurate, select the search tag and then select reviewed UniProt sequences only. Press refine search and you will be presented with a plot showing 84 MDAs (see figure below):
Now that we have an idea of the scale of the number of domain partners associated with the family as a whole, we will now return to comparing our two HUP examples using a different resource. Gene3D assigns CATH domains to genes and annotates them with functional and structural information. We are going to use Gene3D to compare the MDAs of our examples. Multi-chain architectures show all the domains contained within a protein chain.
Next, go to the Gene3D v14 website protein search page here. Input the PDB code, 1od6 into the search box and click the Get Results button. The resulting page will first summarise the list of domain families that are assigned to this query protein (which in this case is just a single protein chain). From the Summary section, and the Domain View section just below, we can see that a single domain has been identified within this protein, which has been assigned to a functional family named “Phosphopantetheine adenylyltransferase”. Scrolling further down the page provides information associated with this query protein such as the: protein sequence, predicted GO term function annotations, known drug targets that bind to this protein, UniProt entries, and Ensembl entries.
Searching for a different HUP domain-containing protein (PDB ID 1f7u) here retrieves a protein with multiple domains where the central large HUP domain is flanked by two smaller domains.
Both structural embellishments and domain partners can affect what substrates can access the active site. PDBsum, a resource that stores information about all the protein files deposited in the PDB, gives substrates for both of our HUP examples (in the ligands section)
For the protein 1od6, the substrate is Pantetheine 4'-phosphate (see upper figure below). For 1f7u the substrate is L-arginine (see lower figure below). The JSmol figures displaying these proteins, their domains and substrates are shown below. 1od6 is a single domain protein and is shown in red with its substrate in white. 1f7u has three domains. The HUP domain shown in red, but with the structural core in common with 1od6 shown in pink. Again, the substrate is shown in white.
These JSmol figures show that, despite these domains being in the same superfamily, they are significantly different in terms of structure, have different MDAs and also substrates that are significantly different in size. The large embellishments seen near the active site of 1f7uA01 may explain why a smaller substrate binds in the active site.
The Aldolase Superfamily
Domains in the Aldolase Class I superfamily (CATH code 3.20.20.70) adopt TIM barrel structures. This is a highly divergent superfamily and there is considerable functional diversity across the superfamily. If you go to the GO diversity and EC diversity pie charts on the superfamily home page, you can mouse over the segments to get a feel for just how functionally diverse this family is. There are 1780 unique GO terms and 412 unique EC numbers.
As already mentioned, further information on functional diversity and, in particular, the reaction mechanisms present in this superfamily, can be found by searching for the family on MACiE. If you type in the CATH code in the field adjacent to the 'Search Catalytic Domain CATH code' button and then click, a page will be displayed providing all the general information held for the Aldolases. 20 different reaction mechanisms are recorded in MACiE for this superfamily.
Clicking on the 'OVERVIEW' link at the bottom of the page brings up a page providing more information on EC number distribution, CATH domain partners and information of the catalytic residues and cofactors present. Scrolling down takes you to a table of Catalytic Machinery Similarities. It compares pairs of catalytic mechanisms present in the Aldolases and calculates how similar they are using an algorithm that combines information on catalytic residues and superposition of the active site. The similarity score is between 0-1. The lower the score, the more different the reaction mechanisms.
For this tutorial, we are most interested in comparing the reaction mechanisms associated with two relatives having different functions. For example, 1h7oA00, Aminolevulinate dehydratase (EC 4.2.1.24) and 1d3gA00, Dihydroorotate oxidase (EC 1.3.3.1). Have a look for the reaction mechanisms corresponding to these ECs in the Catalytic Machinery Similarities table and draw your own conclusion. For more information on this comparison, click on the link within the table. This takes you to a page that compares the two reaction mechanisms side by side.
So, how are these changes in mechanisms mediated?
Firstly, we can explore whether there are any significant structural differences between the domains associated with these functions.
Within a CATH superfamily, structurally-similar relatives are grouped into structural clusters. Each structural cluster is then clustered again into functional families, or FunFams (FFs). The clustering that produces our functional families is performed by our in-house protocol, FunFHMMer ( reference). Each domain clustered within a particular FunFam is predicted to have the same, or a very similar, protein function.
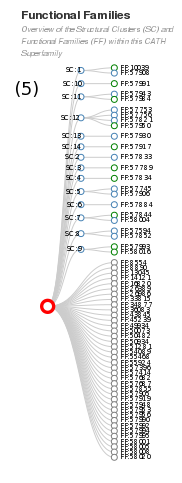
If we go back to the homepage for the 3.20.20.70 superfamily, you will see the functional families tree (see section 5 of the homepage - see below). The Aldolase Class I relatives are clustered into 19 structural clusters, all of which have one or more functional families. There are 286 functional families within this superfamily.
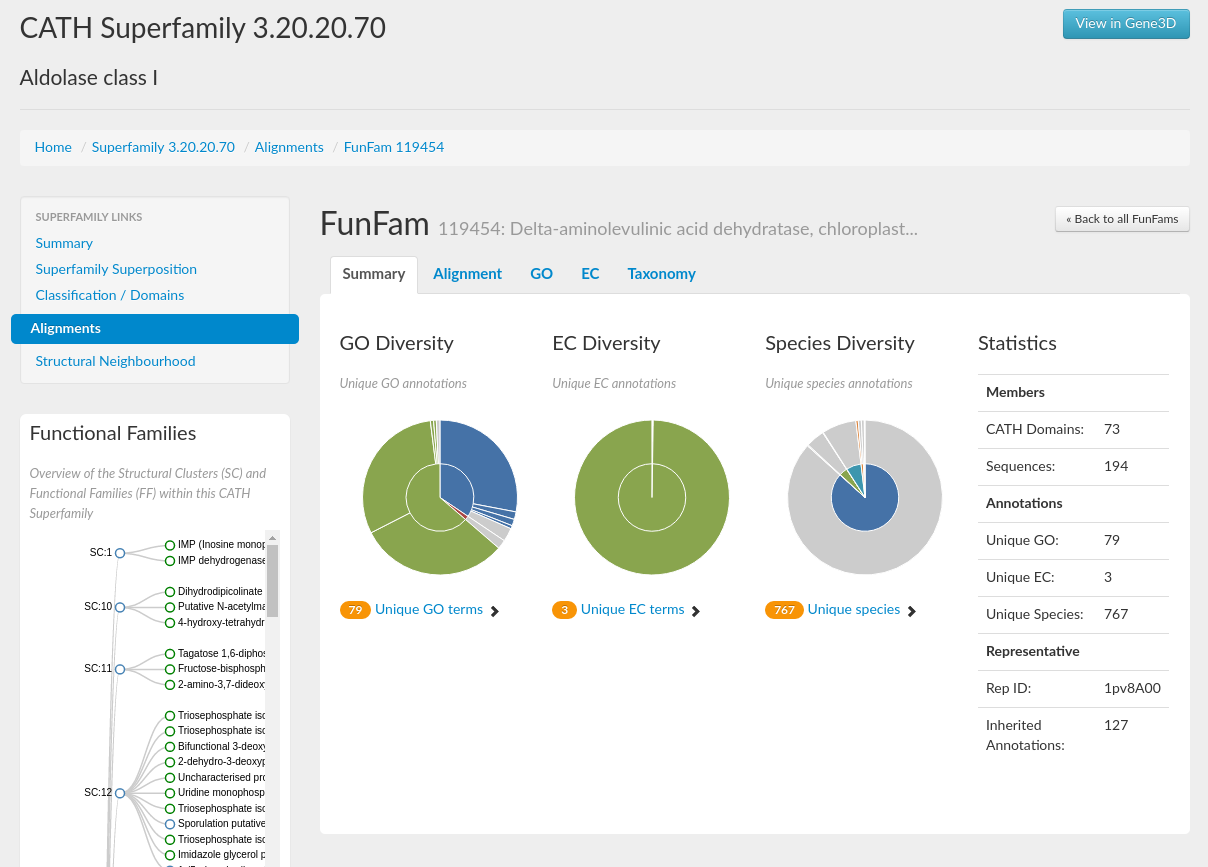
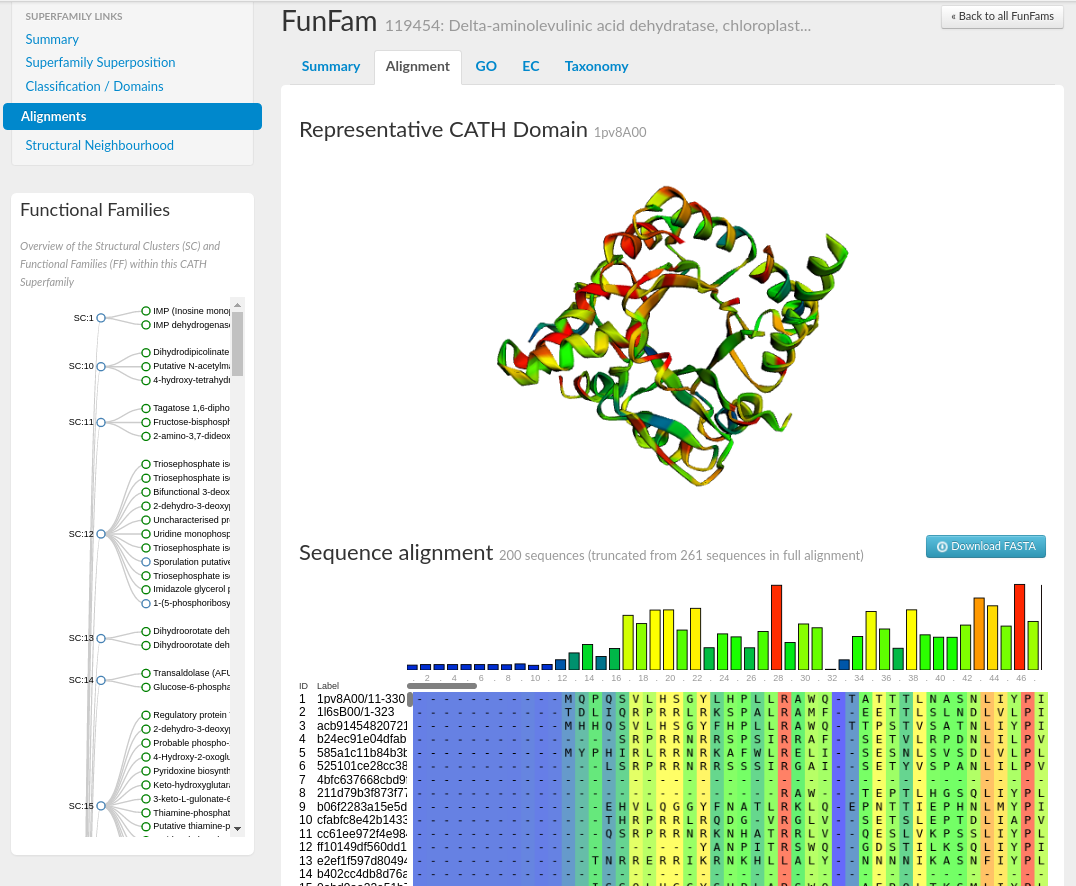
Going back to our two domain examples, domain ID 1h7oA00 belongs to the functional family (ID: 119454) containing protein structures associated with EC number 4.2.1.24, and is called Delta-aminolevulinic acid dehydratase, chloroplastic. The domain ID 1d3gA00 belongs to the functional family (ID: 120487) associated with EC number 1.3.3.1, Dihydroorotate dehydrogenase.
You can search for further information on these FunFams by selecting the Alignments tab under the Superfamily links on a superfamily homepage. Entering the FunFam ID into the filter text box will bring up the FunFam of interest. If you click on each of the functional families' names, which are hyperlinks, you will see a page displaying a summary page for that FunFam.
Like the superfamily summary pages: GO term, EC term, and species information is provided for each FunFam, as well as statistics including the number of domains in the family and the representative domain ID.
Selecting the Alignment tab on the FunFam page will load a visualisation of the FunFam representative domain structure using the tool, 3Dmol.js (reference). The multiple sequence alignment (MSA) is shown below using the tool, MSAViewer (reference). Conservation scores have been assigned to each position in the MSA using Scorecons (reference), and the residue positions have been coloured accordingly from fully conserved (in red) through to no conservation (in blue). Residue positions in both the MSA and on the representative structure have been coloured accordingly.
Have a look at each of the representative structures for both of the FunFams we have just looked at, and also those of other functional families to get a feel of the general structural diversity within the superfamily.
SSAP was run for our two relatives above. Below are two JSmol figures. They show the structures with the structural features common to both domains coloured blue (1h7oA00) /red (1d3gA00) and structural features not identified as being common to both proteins coloured light blue ((1h7oA00) /pink (1d3gA00).
Substrates for the two proteins are shown as spheres and indicate the location of the active site. It can be seen that the common core between the two structures is large and there are very little structural embellishments.
The next thing we can look at is whether or not there are local changes, particularly around the active site, for example, residue mutations in the site and changes in catalytic residues. Taking 1h7oA00 and 1d3gA00 as our examples, we can go back to their respective functional family pages and look at the multiple alignments for those families. Highly conserved residues are highlighted in the alignment (as shown above) and the structure and you can compare them side by side to observe any differences. We are currently in the process of adding in catalytic residue information to the FunFam pages so that conserved residue and catalytic residue information can be viewed on the FunFam MSA and the representative structure.
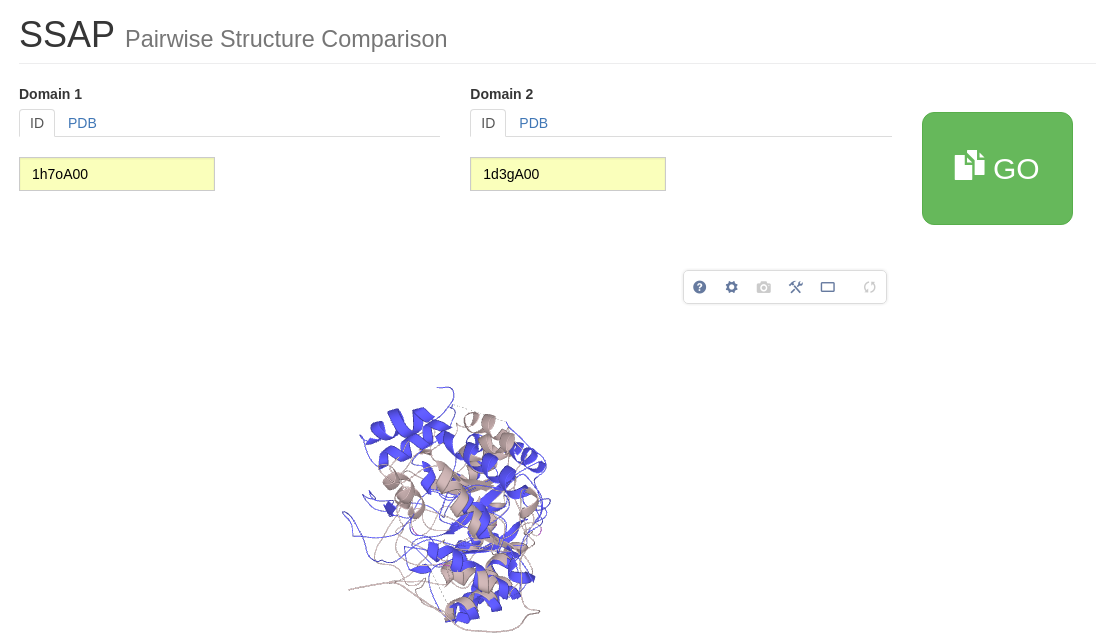
We can also use SSAP to create a superposition of our two proteins and then compare the position of functional residues. Just type 1h7oA00 as protein 1 and 1d3gA00 as protein 2 and click on ‘GO’. An interactive LiteMol visualization of the superimposed structures in cartoon representations is shown.
The Catalytic Site Atlas is a database containing enzyme active sites and catalytic residues in enzymes. We want to use this resource to determine the catalytic residues for our aldolase examples and map them onto the RasMol 3D structure. At the top of the homepage, you will find a field labelled PDB code. Type in 1h7o and then 1d3g to get a list of catalytic residues for these proteins (see picture below for example)
A jmol of the SSAP superposition has been provided with the catalytic residues of the domains highlighted. Here, 1h7oA00 is in pink, with its catalytic residues red and 1d3gA00 light blue with its catalytic residues blue
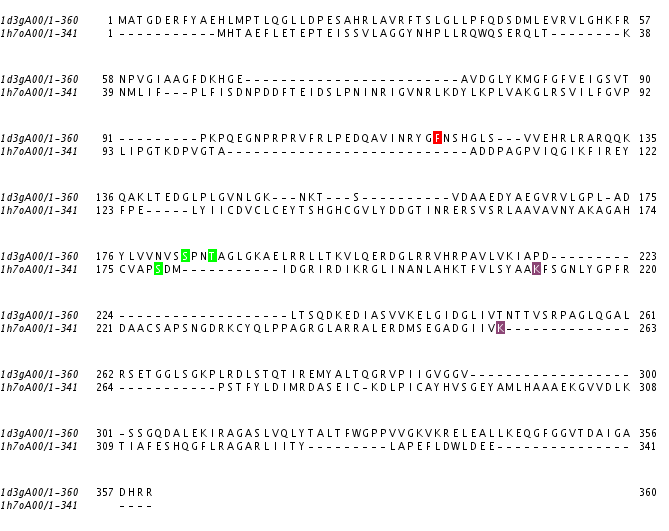
It can clearly be seen that the catalytic residues of these two domains are in different 3D locations in the active site. A SSAP alignment of the two domains is below which highlights catalytic residues according to their properties. Aromatic residues are in red, polar residues in green and those with a positive charge are in purple.
In this case, unlike the HUPS, it is unlikely that any global structural changes have resulted in the functional diversity observed in this family. Our analysis suggests that changes in chemistry occurring in diverse relatives in this superfamily are more likely to be associated with changes in the 3D location and nature of the catalytic residues in the active site.
The HUP Superfamily in GENE3D
We are going to finish this tutorial with another example of HUP domain protein in Gene3D. We will look at a classic HUP containing protein known as QARS which is a Glutaminyl-tRNA synthetase. Begin by going to the Gene3D website protein search page here and input the search term 'QARS'.
A number of proteins are retrieved, select the first protein in the table (UniProt ID: SYQ_HUMAN). or click here for a direct link to the page. Selecting the 'Domain View' from the left-hand menu, we can see that this protein has many domains flanking the central HUPs domain.
Structural models
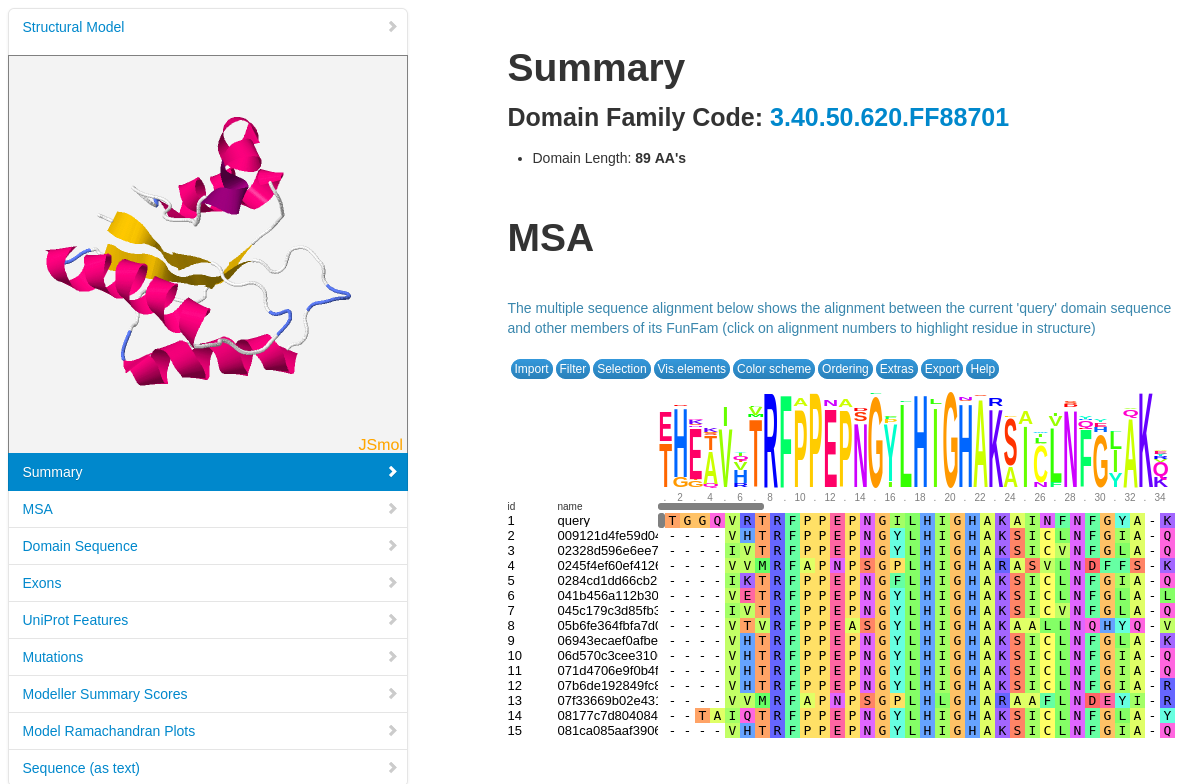
Structural models have been built using MODELLER (reference, where possible, for FunFams that have no structural domain representative. Under the 'Domain Table' section of the page, domain families assigned to our query protein that belong to such FunFams with a modelled representative structure are listed.
The screenshot below shows an example of the page loaded when you select a Show Domain Sequence and Modelled Structure. The MSA for the domain FunFam is shown, together with the structural model.
Mutations
Mutations provided by UniProt are mapped onto our query protein sequence. We can see that there are 4 curated mutations and 19 non-curated mutations. Select Click to Show Graphical View of Mutations on Domains to view all 23 mutations mapped onto the domains in the protein sequence. The curated mutations are shown on the needle plot in light blue and the non-curated mutations are in dark blue.
Protein Interactions
Scrolling through the page you can see this protein has multiple physical protein interactions. Some of these are with proteins from a known disease-causing bacterium, suggesting a possible role for this protein in disease progression. (NB. Instead of scrolling you can use the navigator box on the left to jump to different sections).
Extra work
If there is time, explore the domains of your own favourite protein using this Gene3D search page.

